We are well aware that our pastors and church leaders are busy people, which is why we took the feedback to our annual ministry review seriously by significantly trimming it down. We had a multifaceted goal of making the annual ministry review easier to complete, and more useful to the people filling it out, not just to us. But it is still very useful to us, and when we bring all of that data together, we think it has something to say. We’re still in the process of sorting through the responses but we wanted to share some highlights that we think are both interesting and motivating. And, as a gentle reminder, if your church hasn’t completed the Annual Ministry Review, you still can, here:
We’d be mighty appreciative.
*Note 1: Of the nearly 300 churches in USA churches, we received almost exactly half of the ministry reviews back. While still generally representative, these statistics are not 1 to 1 representations of our churches. Smaller regions may perceive divergent patterns in comparison to the data represented here.
*Note 2: Of those who did respond, not all respondents answered every question on the survey.
What Percentage of Your Congregation Gives Financially Every Year?
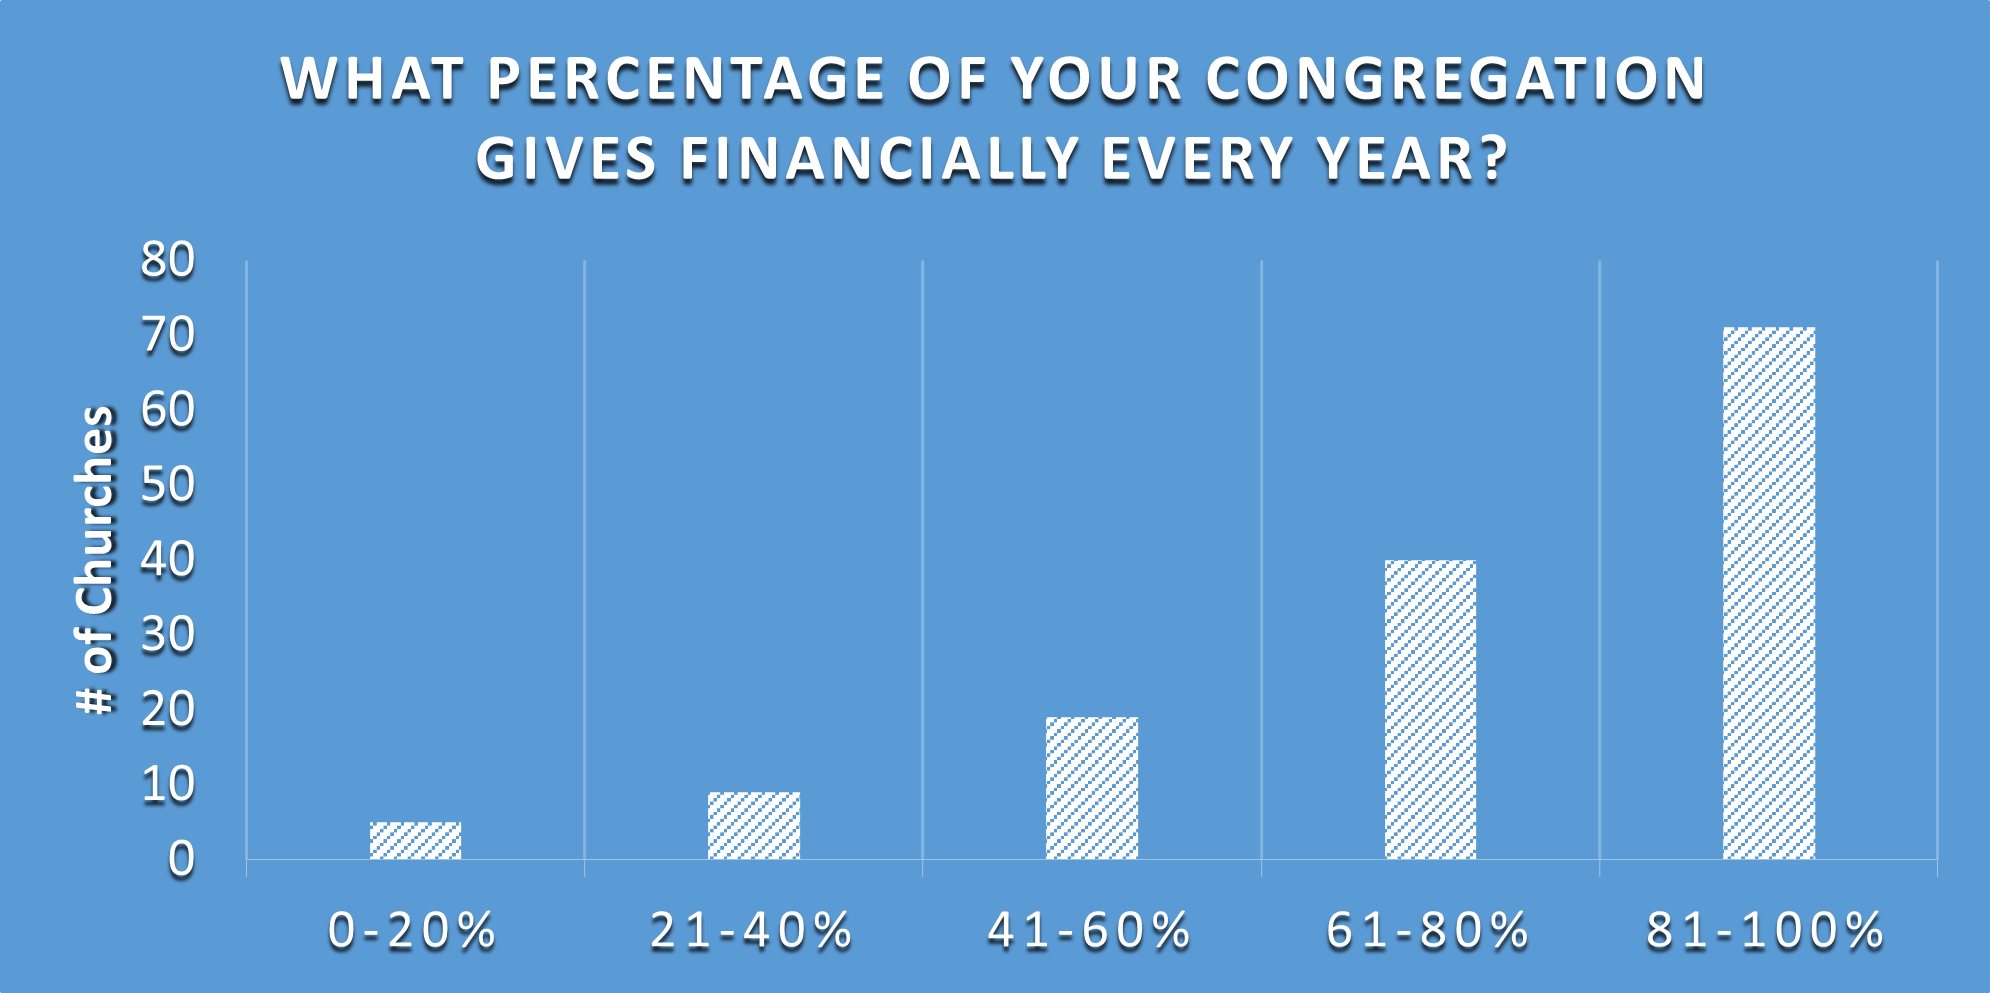
Beginning on a positive note, the vast majority of congregants are giving financially every year, with 77% of reviews reporting more than 60% of their congregation gives. Even more positively is that about half (49%) of churches reported that more than 80% of their congregation gives. There are a couple of ways we could interpret this data.
First, it means that in the CGGC, our people are generous and supportive of our churches. It means that congregants are happy to support churches and that for those who attend, church is a meaningful enough part of their life that they will routinely give financially toward it.
Second, this means that for most of our churches, there probably isn’t a lot of financial headroom left in their current congregations. Without more people attending the church, it’s unreasonable to expect giving to increase as the majority of congregants are already giving. We didn’t ask about the average giving amount, and for most regions, we didn’t collect data on church income, so we can’t comment on how much congregants are giving, but we can say that most are giving something.
What Percentage of Your Congregation is Taking an Active Leadership Role in the Congregation or Church Community?
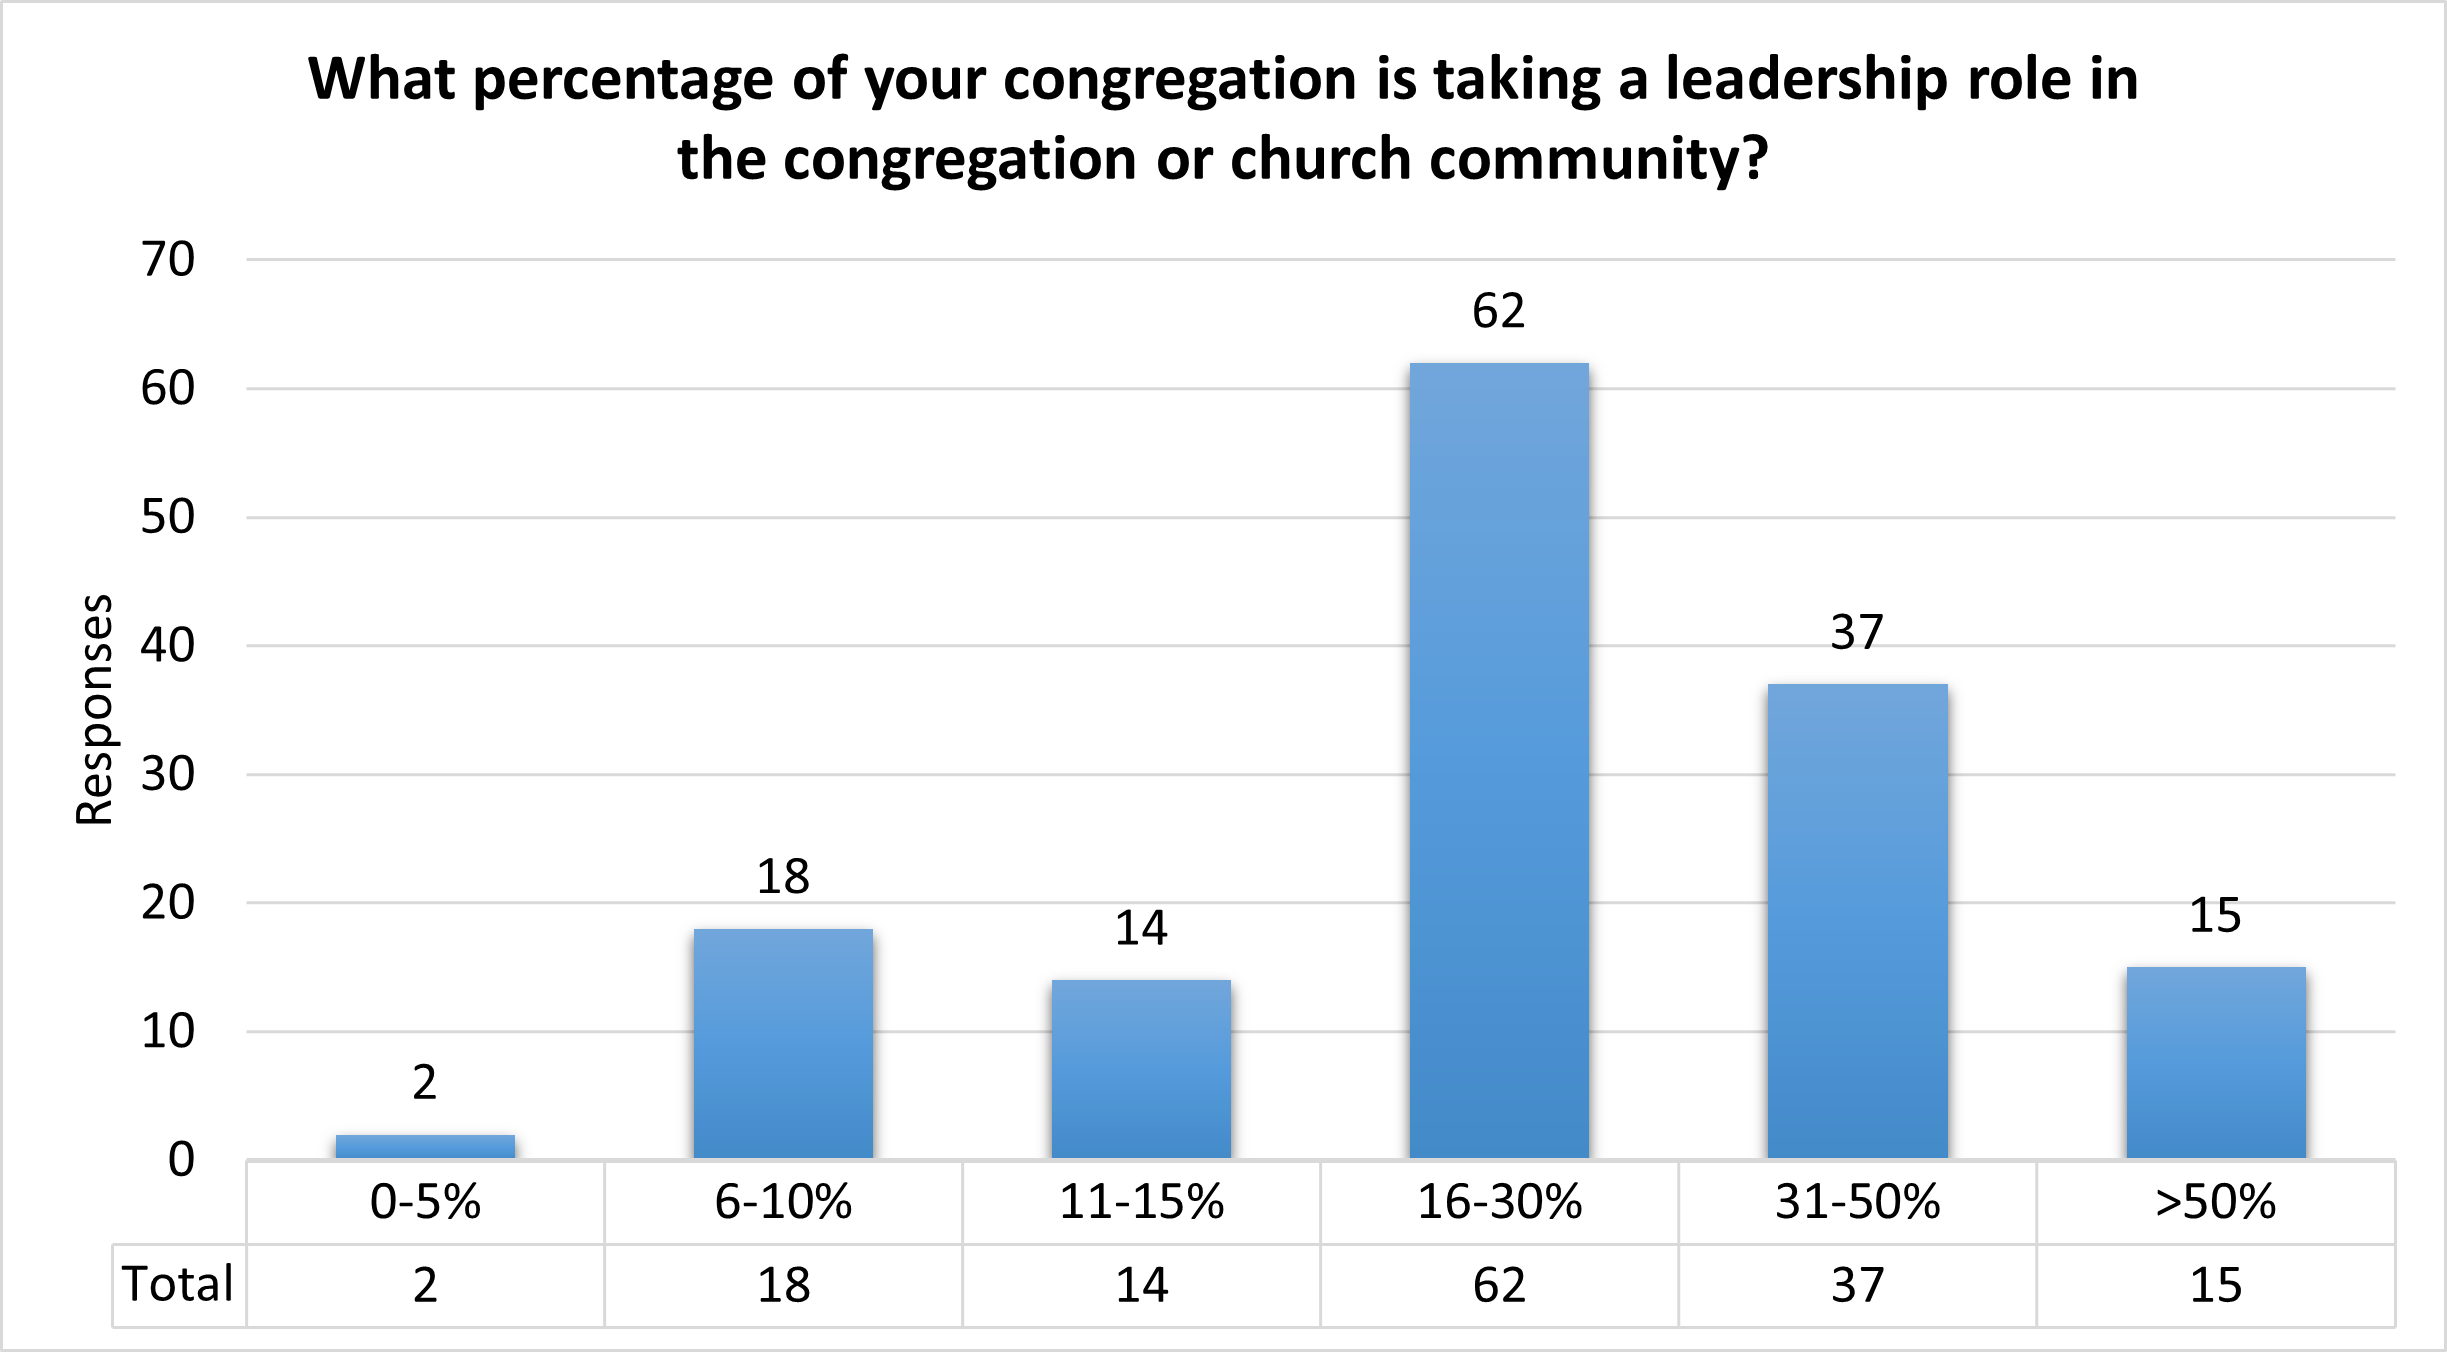
The chart above shows that for the majority of churches, less than 30% of their congregants are taking a leadership role in the church or community. While we did not define “leadership” in the annual ministry review, we interpret that most of our congregants are not leading small groups, bible studies, are not serving as pulpit supply, elders, deacons, trustees, or other forms of leadership.
It’s not unexpected that capacity for leadership opportunities within the church are limited in both large and small churches. At a certain point, this could be exacerbated for large churches too, as mobilizing 30% of the congregation in active leadership roles is a lot of people in a church of 300+ congregants.
In combination with the previous section of data, one interpretation might be that congregants feel that their giving is sufficient for service toward the church. In this way, we might understand the data as suggesting that our congregants are crunched on time and obligations, but not as crunched on funds. An alternative interpretation would suggest that the pressure to give financially is stronger than the pressure to serve in a leadership role.
It's likely a mix of both of these interpretations (and more) that account for the current statistic. This should help us reflect on our current metrics of success around discipleship. What do we mean when we say we want to “deploy” disciples? What kind of numbers do we have in our heads when we set goals around discipleship and deployment? Is less than 30% sufficient in terms of a discipleship pipeline? For national, regional, and local church leadership, these questions may help us hone our understanding of the task before us.
Does your church participate in feet washing, if so, how often?
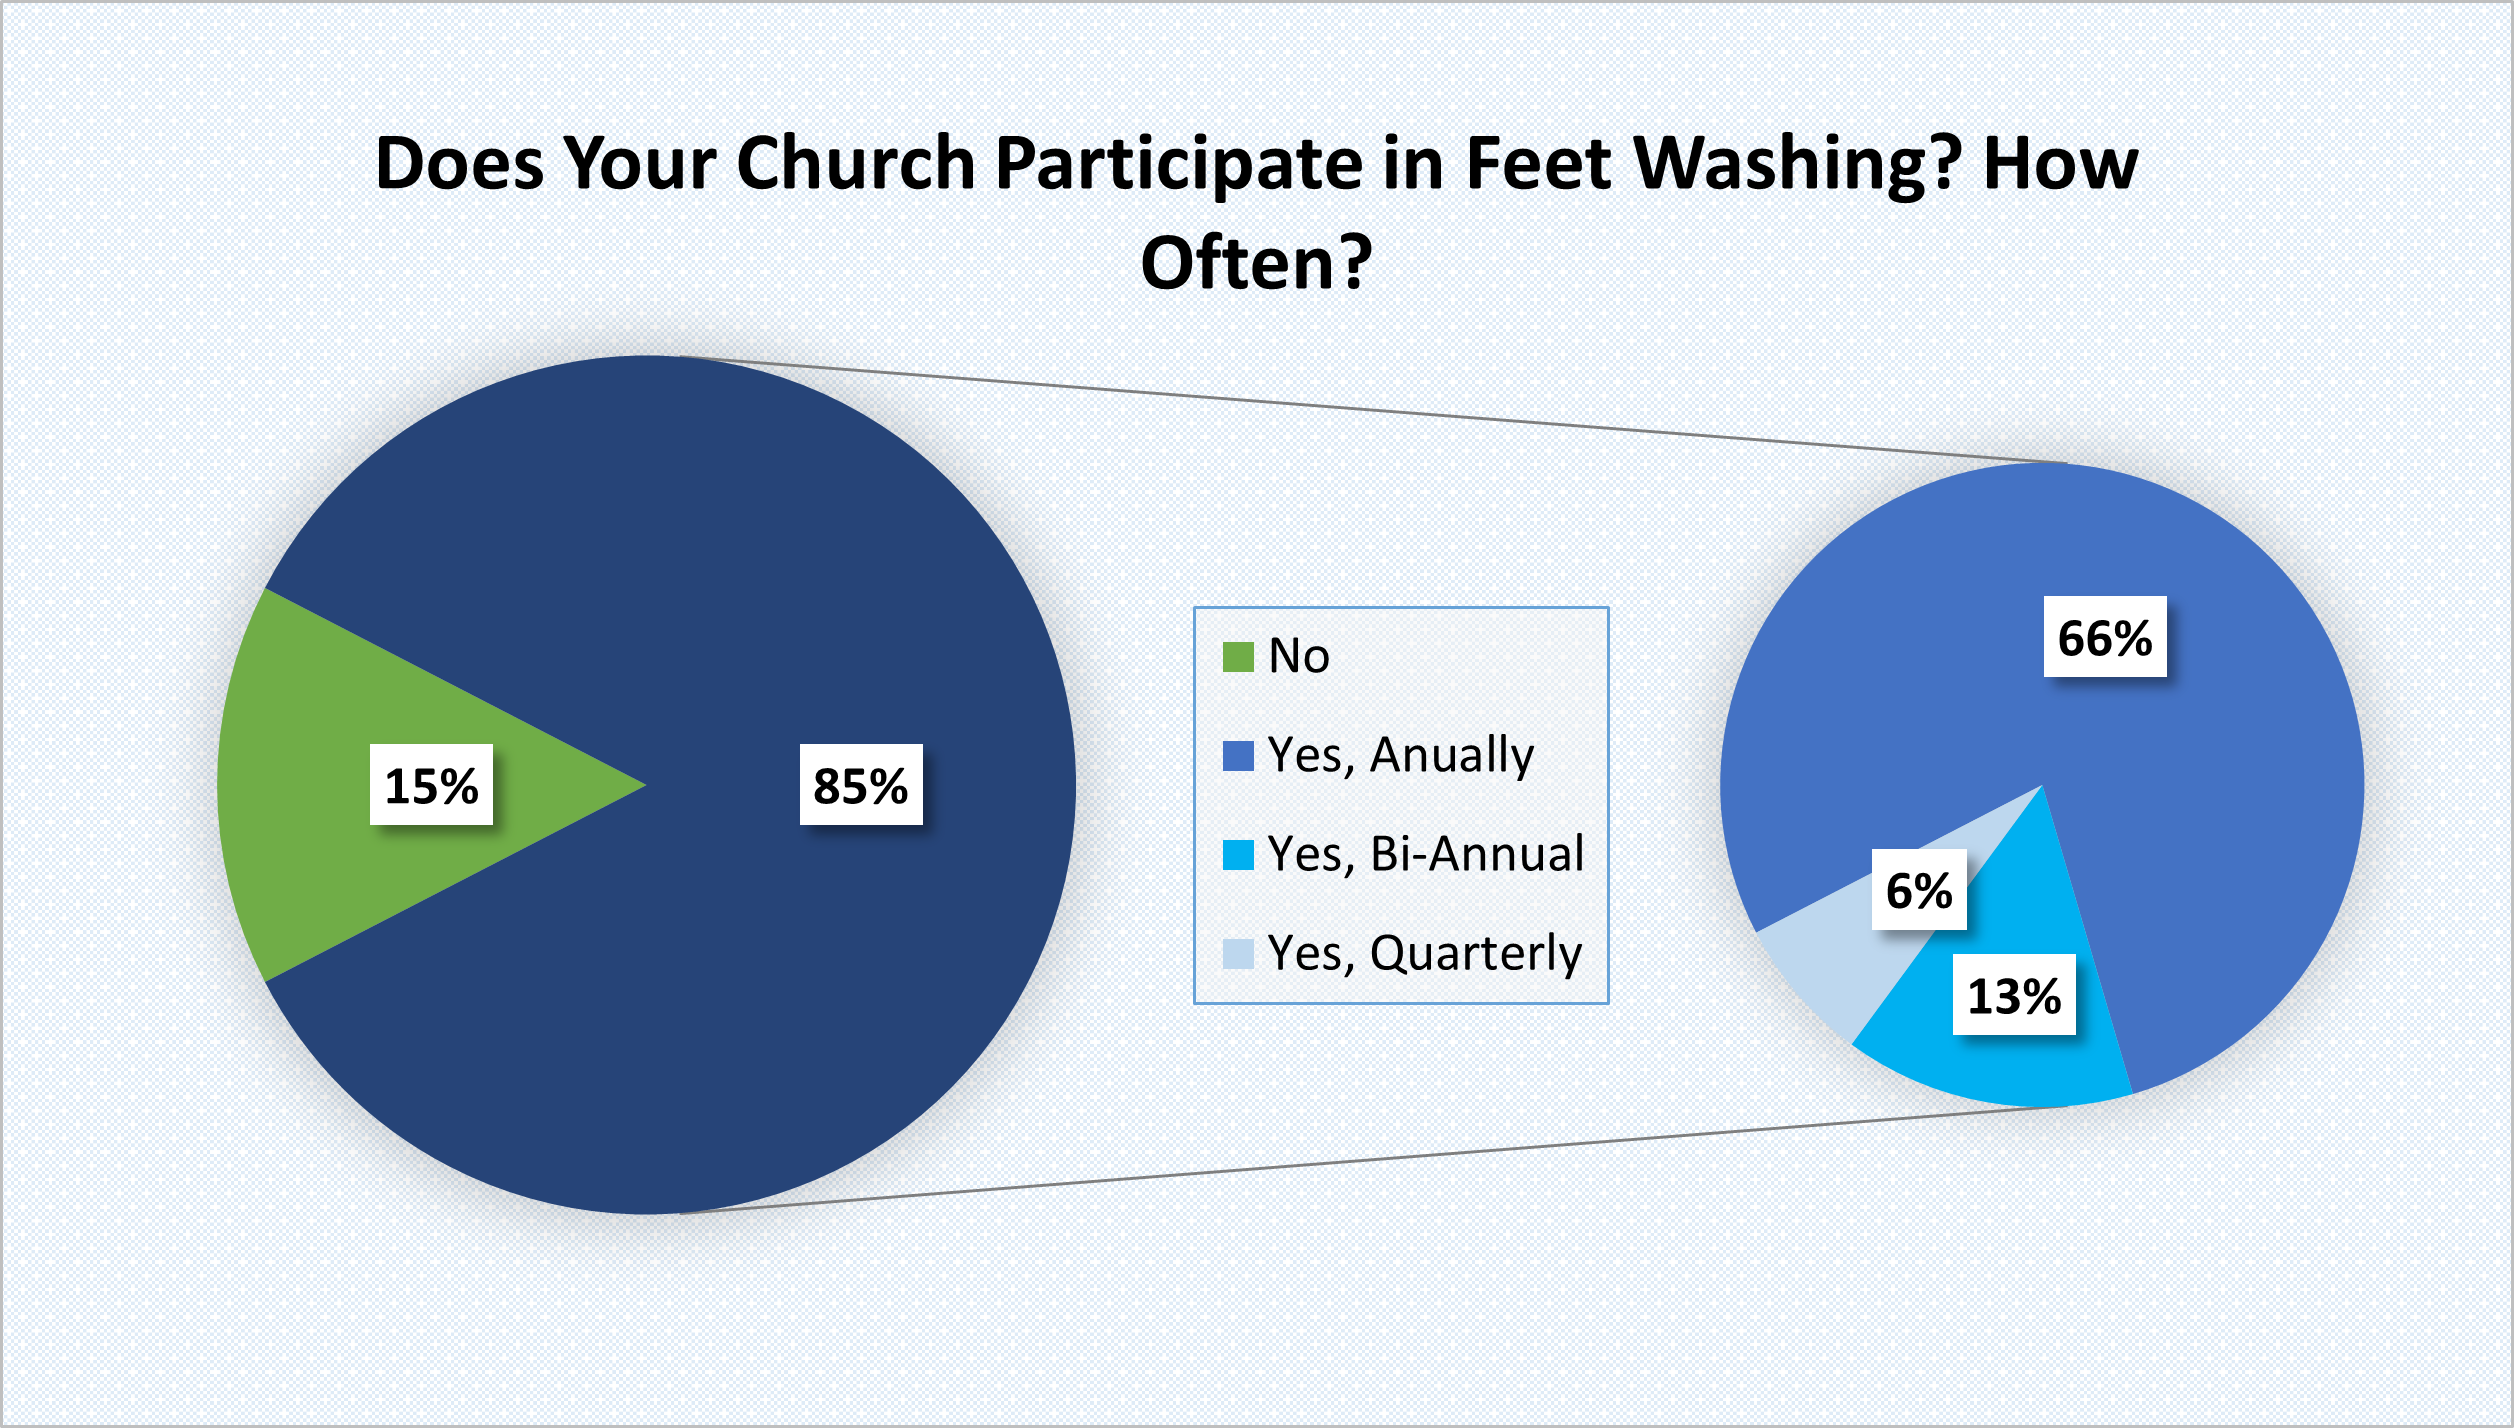
On another positive note, the reviews tell us that about 85% of our congregations partake in feet washing. We recognize that in a post covid world, many touch related traditions have been denormalized, and so we anticipated this number to be lower than it might have been in the past. Thankfully, a number of churches have returned to feet washing as an ordinance that they practice. As for how often, the majority do it annually on Maundy Thursday. A smaller but noticeable portion do it twice year, while fewer still have quarterly feet washing services.
For those churches that have not performed a feet washing service in a while, we would strongly recommend trying again, even if that means some type of recontextualization. For instance, a hand washing service may be preferable to start if elderly congregants are unable to bend down.
Does your Monthly Offering/Tithe Exceed Your Monthly Expenses?
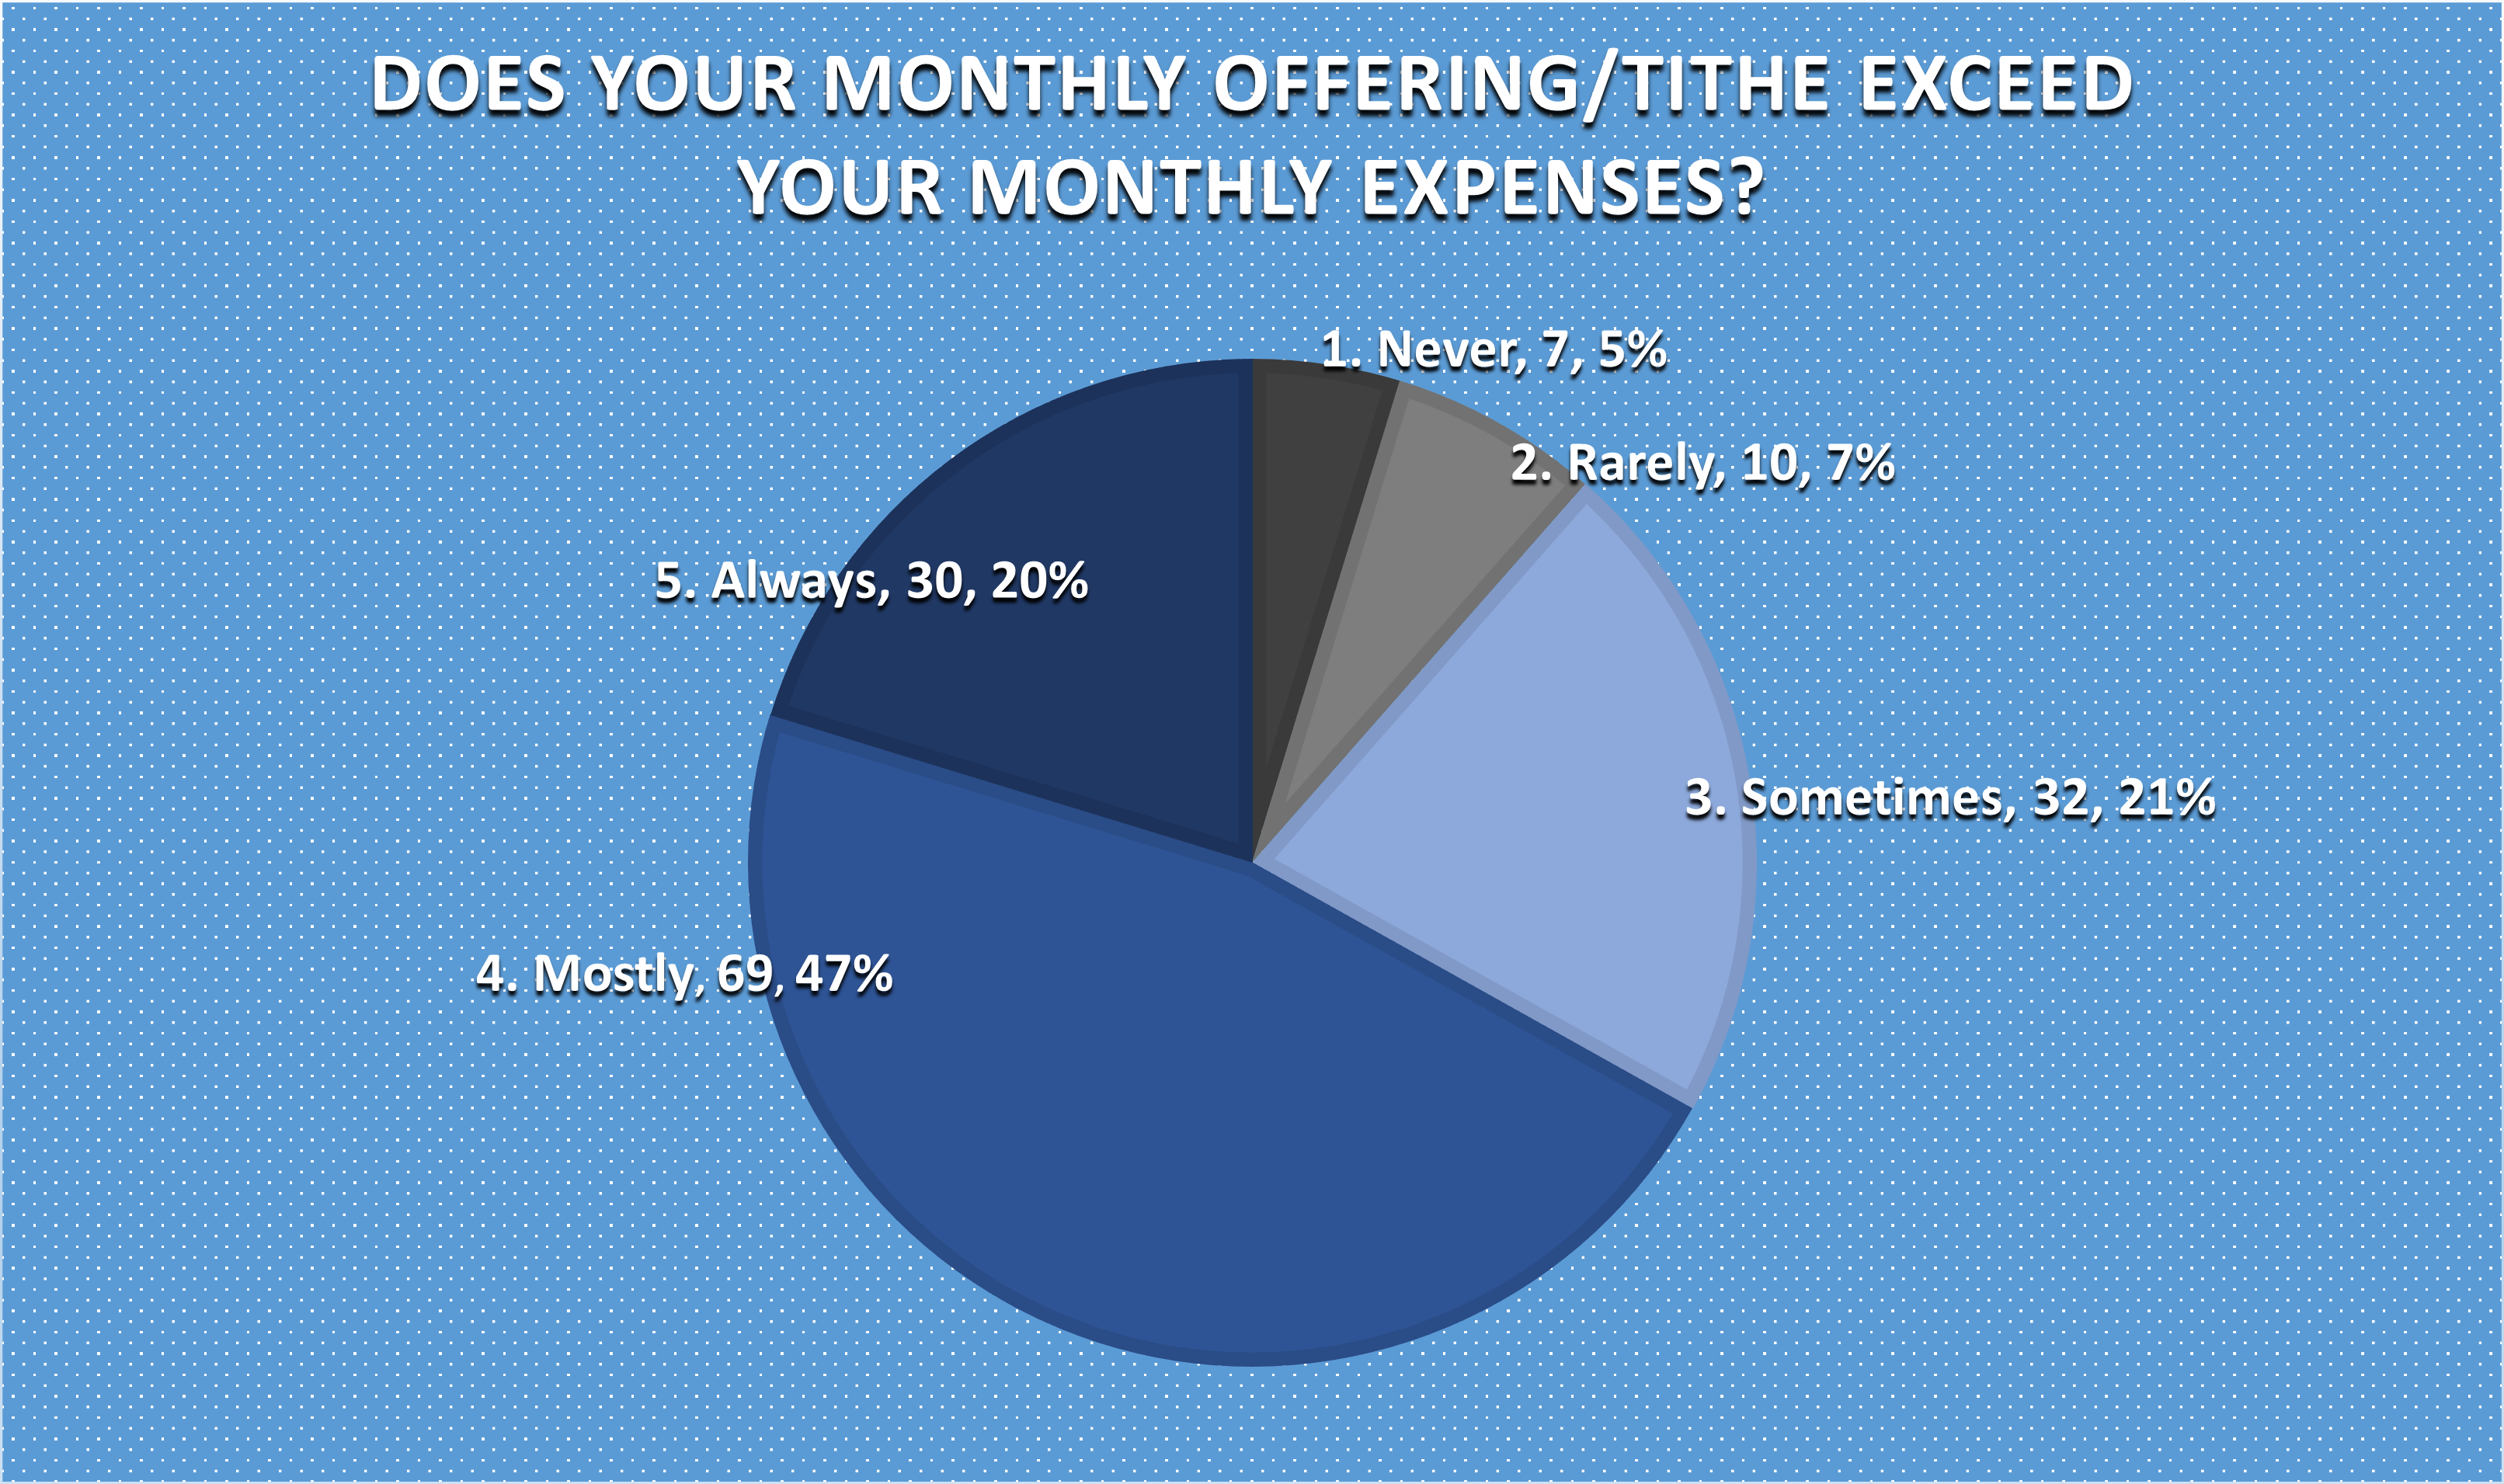
The heart of this question was not to get hard financial numbers, but to do a checkup on the health of our churches. Thankfully, for the majority of our churches, approximately 67%, their monthly offering/tithe exceed their monthly expenses. We take this to mean that the majority of our churches were financially self-sustaining in 2023.
On the other hand, this means that, for approximately 1/3 (33%) of our churches, they are not financially self-sustaining. This does not necessarily mean that 33% of churches are in financial trouble, but that other sources of income may be used to supplement or make up for the differential between the monthly offering and the monthly expenses. For instance, endowments, investments, or other spontaneous giving may help bring these churches into relative financial stability when the offering falls short.
Does Your Vision or Mission Statement have Metrics that are Actively Measured?
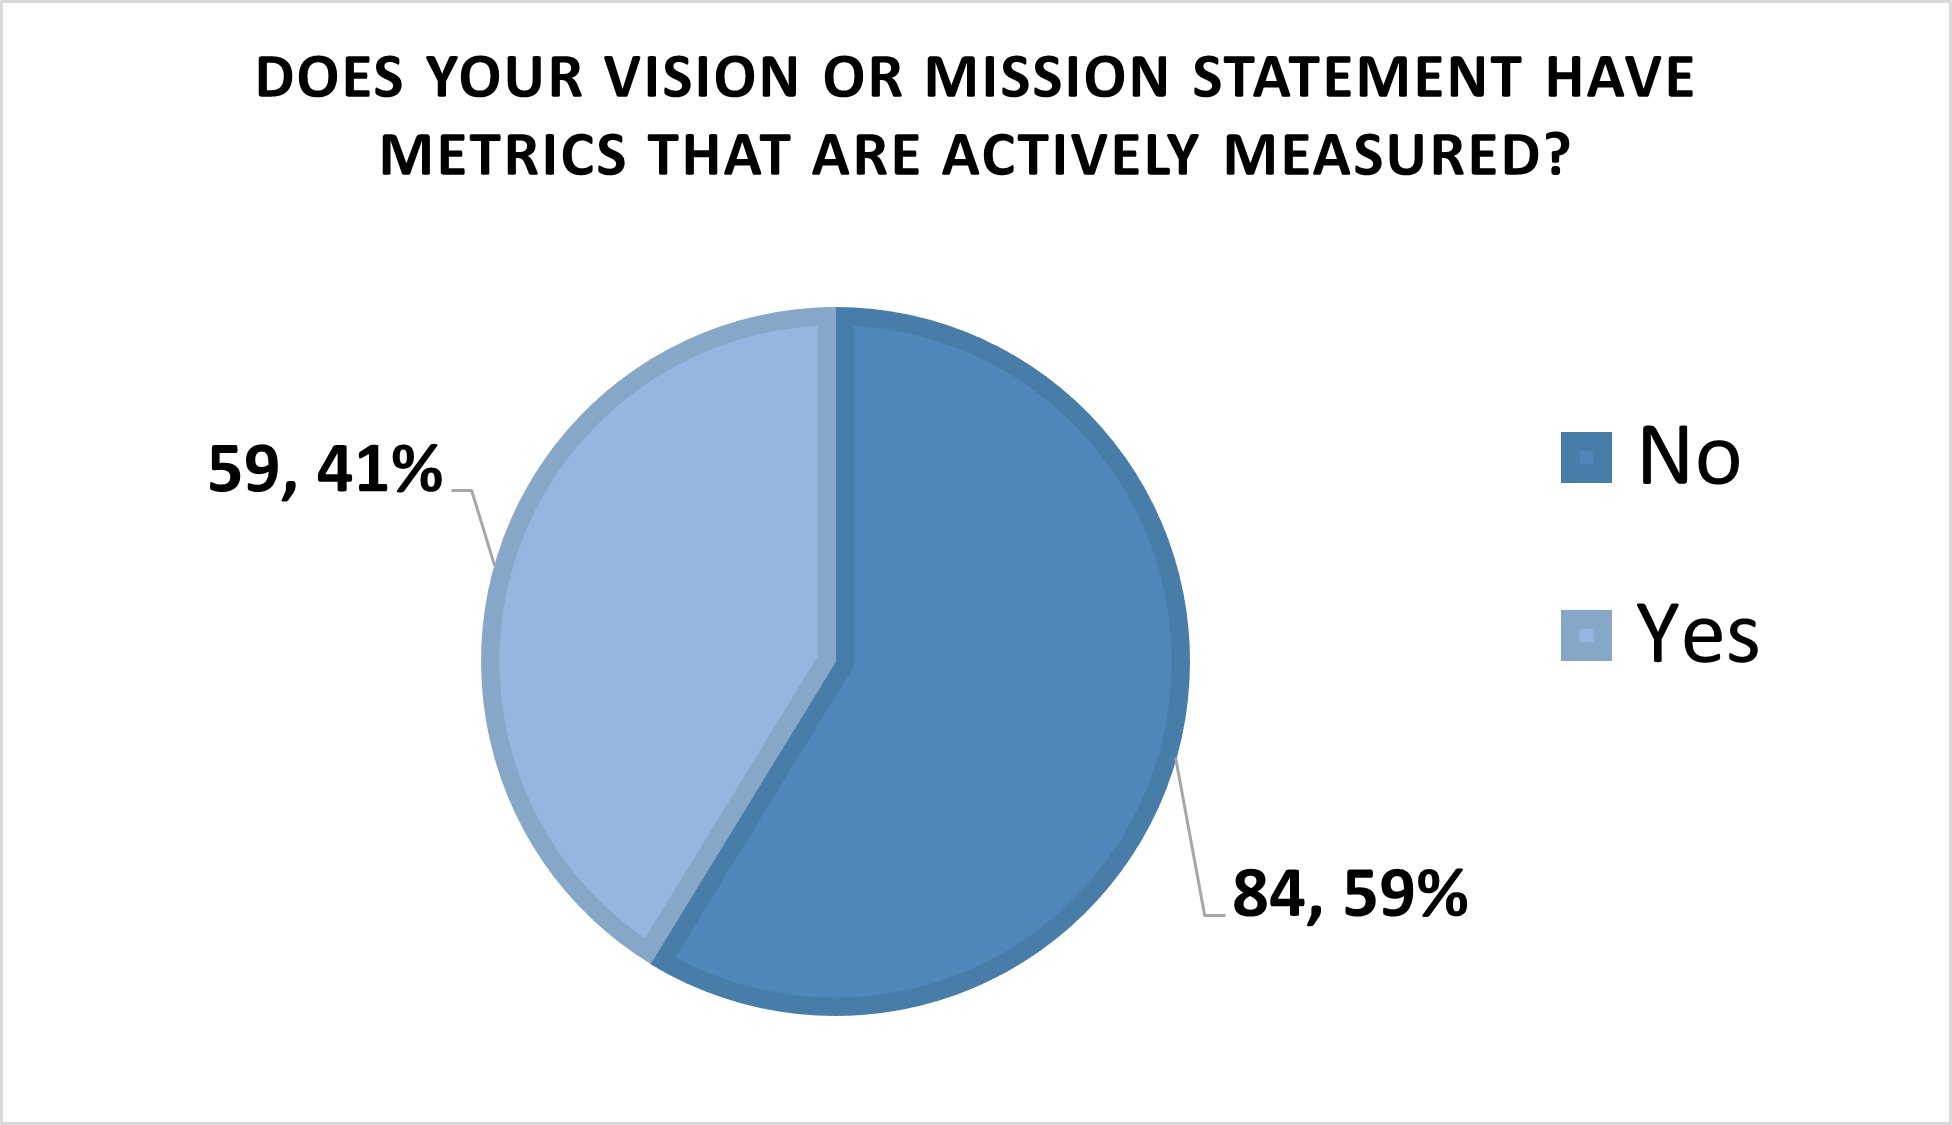
In the spirit of measuring, we asked our churches about whether or not they have developed their own internal metrics for their vision or mission. The responses show that the majority of our churches do not have a metric to measure this. This is a relatively new concept for our churches, so we aren’t surprised to see this result. Instead, we take it as a sign that we are moving in the right direction, and that more work needs to be done to help churches develop clear metrics that will set their eyes on a clear mission.
At our last Triennial Conference in 2022, much of the focus was on how new metrics help orient us. If we aren’t counting, or if we are counting the wrong things, then it’s hard to know if we are making progress toward the right mission. We understand that within the Great Commission, each church has a different emphasis in their vision and mission. So, it’s not our intention to tell churches that they are “doing it wrong”, but to help them succeed at their own contextual mission and vision.
For instance rather than measuring attendance as a metric of their vision, churches might measure how many leaders they are developing in their church (hence us asking that question earlier!) It’s our intention that this new Ministry Review could act as a model for the kinds of metrics that more accurately measure where we are.
If your church doesn’t have metrics for your vision and mission, let us know by leaving a comment below, or by reaching out to Pastor Brandon Kelly at .
These 5 questions are just a snapshot of the entire annual Ministry Review, and we are eager to share more data with you as we continue to dig in. Likewise, we are open to feedback on this new ministry review. We want this to be a tool that serves churches individually, and the denomination wholistically. Feedback on the ministry review can be provided by email directly to .
CGGC eNews—Vol. 18, No. 36


Login To Leave Comment